
I once spent three weeks convinced that I’d discovered a new ERP component around 800ms post-stimulus. The effect was robust, highly significant, and showed up consistently across participants. I was already drafting the paper when a colleague asked to see my eeg filtering parameters. Turns out my overly aggressive high-pass filter (2 Hz cutoff) was creating a ringing artifact that perfectly mimicked a late ERP component.
That humbling experience taught me that eeg filtering isn’t just about removing noise – it’s about making informed trade-offs between noise reduction and signal preservation. Every filter you apply changes your data in fundamental ways, and some of those changes can create artifacts that look suspiciously like the neural activity you’re trying to study.
The tricky part is that filtering artifacts often don’t look like obvious artifacts. They can have realistic topographies, appropriate timing, and even statistical significance. The only way to catch them is to understand what your filters are actually doing to your data, not just what they’re supposed to do.
The Audio Equalizer Analogy That Finally Made Sense
Think of EEG filtering like using an audio equalizer on your stereo system. When you boost the bass or cut the treble, you’re not just adjusting volume – you’re fundamentally changing the relationship between different frequency components of the music. Turn up the bass too much, and you might create distortion that wasn’t in the original recording.
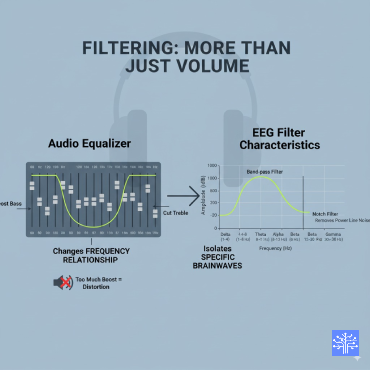
EEG filters work the same way. A high-pass filter doesn’t just “remove” low frequencies – it attenuates them while potentially creating phase shifts and temporal artifacts that can manifest as phantom components in your time-domain analysis. The key insight is that there’s no such thing as a “perfect” filter that removes exactly what you want without affecting anything else.
Just like you wouldn’t use the same equalizer settings for classical music and heavy metal, you shouldn’t use the same filter parameters for sleep EEG and motor imagery classification. The optimal filtering approach depends entirely on what signals you care about and what artifacts you’re trying to eliminate.
High-Pass eeg Filtering: The Most Critical Decision You’ll Make
High-pass filtering is probably the most consequential preprocessing choice because it affects everything downstream – artifact removal, spectral analysis, and even the morphology of time-domain components. Yet it’s often treated as a simple binary decision: filter or don’t filter.
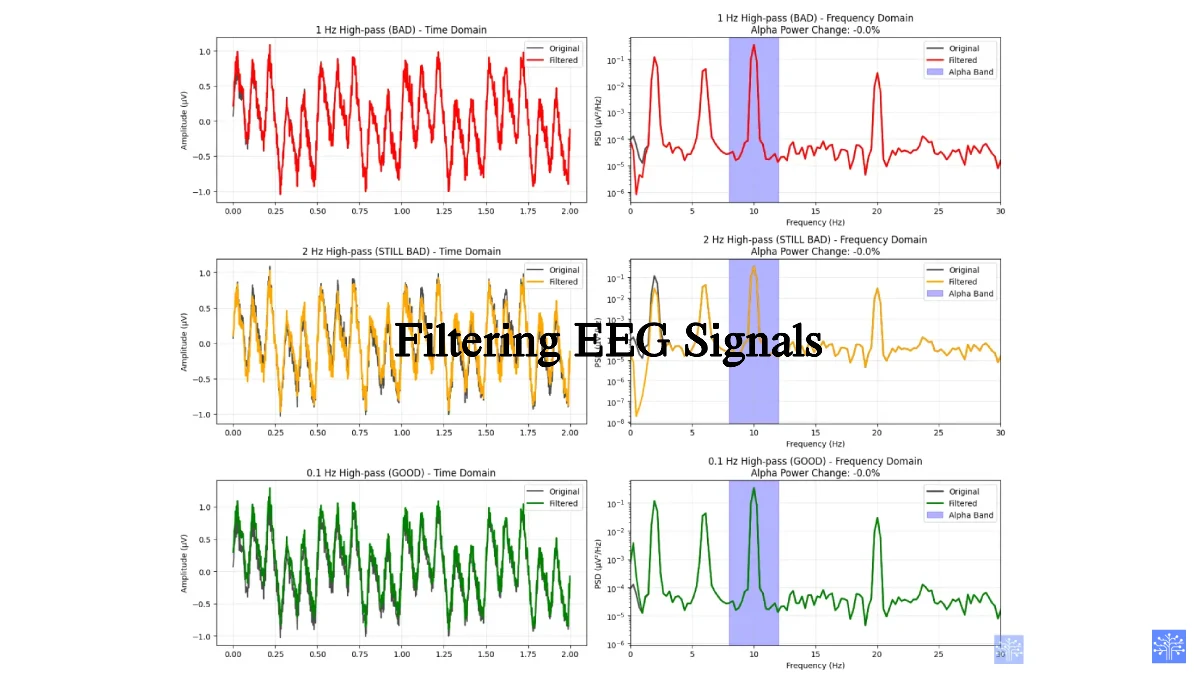
During my research, I’ve learned that the high-pass cutoff frequency involves a fundamental trade-off between removing slow drifts and preserving genuine low-frequency neural activity. Set it too low (like 0.1 Hz), and you’ll have DC drifts and slow artifacts contaminating your analysis. Set it too high (like 1-2 Hz), and you’ll distort your ERP components and potentially create the kinds of ringing artifacts that fooled me.
My practical guidelines (developed through lots of trial and error):
- Sleep/clinical EEG: 0.3-0.5 Hz (need to preserve delta activity)
- Cognitive ERPs: 0.1-0.5 Hz (depending on whether you care about slow components)
- Motor imagery/BCI: 0.5-2 Hz (can be more aggressive since you’re focusing on mu/beta rhythms)
- High-frequency analysis: 1-4 Hz (removes slow artifacts that can contaminate spectral estimates)
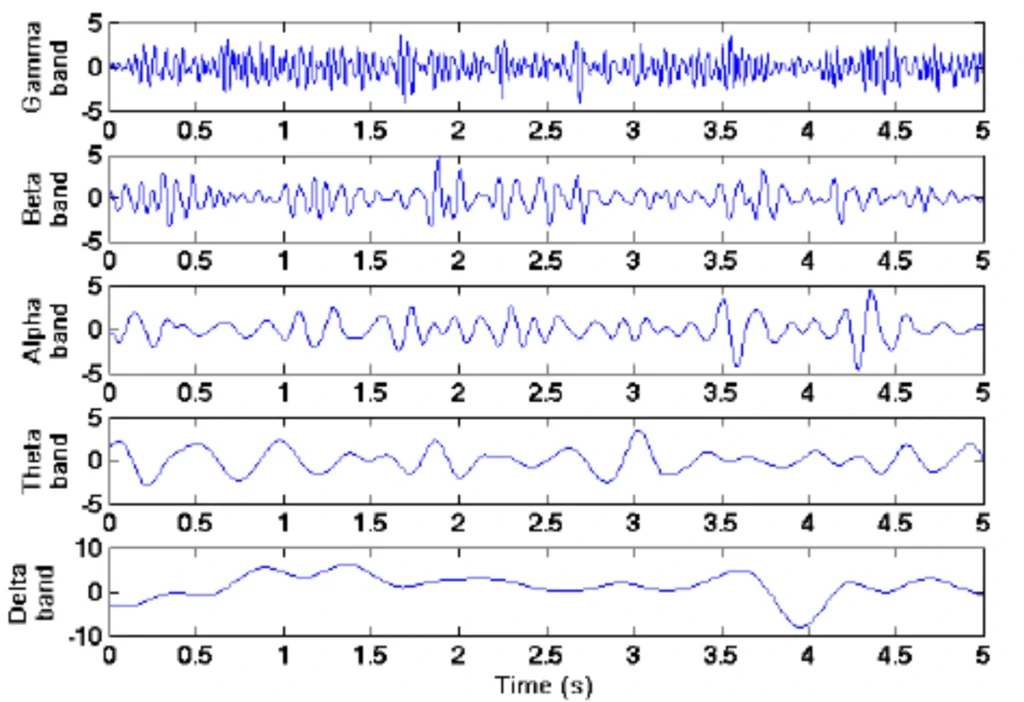
Image credits : Abo-Zahhad, Mohammed & Ahmed, Sabah & Seha, Sherif Nagib. (2015). A New EEG Acquisition Protocol for Biometric Identification Using Eye Blinking Signals. International Journal of Intelligent Systems and Applications (IJISA). 07. 48-54. 10.5815/ijisa.2015.06.05. 10.5815/ijisa.2015.06.05
But here’s something that took me way too long to appreciate: the filter cutoff frequency is where the response is -3dB (50% amplitude), not where the filter completely blocks signals. A 1 Hz high-pass filter still affects frequencies up to 2-3 Hz, depending on the filter characteristics.
Low-Pass eeg Filtering: Simpler But Still Tricky
Low-pass filtering seems more straightforward because you’re usually just trying to remove high-frequency noise and aliasing. But there are still gotchas that can trip you up if you’re not careful.
Anti-aliasing for downsampling: If you’re planning to downsample your data later, your low-pass filter needs to prevent aliasing at your target sampling rate. I learned this during a study where I filtered at 40 Hz but later downsampled to 100 Hz. The filter wasn’t steep enough to prevent aliasing, and I got phantom frequency components in my downsampled data.
EMG contamination: The biggest challenge is distinguishing between genuine high-frequency neural activity (like gamma oscillations) and muscle artifacts. Both live in the same frequency range (30-100+ Hz), and traditional low-pass filtering can’t separate them effectively.
I’ve become pretty conservative about high-frequency activity in scalp EEG. Most of what people call “gamma activity” is probably muscle contamination, especially if it’s over 50 Hz. Real cortical gamma that survives volume conduction is rare and usually requires very careful artifact control.
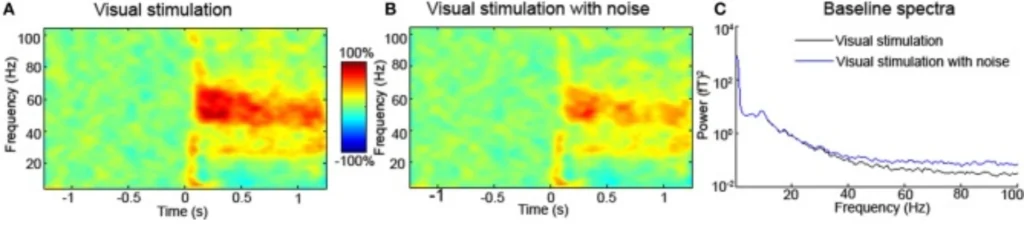
Image source-Muthukumaraswamy, S. D. (2013). High-frequency brain activity and muscle artifacts in MEG/EEG: a review and recommendations. Frontiers in Human Neuroscience, 7. https://doi.org/10.3389/fnhum.2013.00138
Filter Design Parameters That Actually Matter
Filter design involves several parameters that interact in non-obvious ways. Understanding these trade-offs helps you make informed choices rather than just accepting software defaults.
Filter order: Higher-order filters give you steeper rolloff (sharper frequency cutoffs) but can introduce temporal artifacts like ringing and overshoot. I typically use 4th-order Butterworth filters as a good compromise between steepness and temporal behavior.
Filter type: Butterworth filters have smooth frequency responses but modest rolloff. Chebyshev filters have steeper rolloff but can introduce ripples in the passband. Elliptic filters are even steeper but have ripples in both passband and stopband.
My honest opinion? For most EEG applications, stick with Butterworth filters unless you have a specific reason to need something else. They’re well-behaved, predictable, and don’t introduce the kinds of artifacts that can confound your results.
Zero-phase vs. minimum-phase filtering: This is a critical distinction that many people don’t understand. Zero-phase filters (applied forward and backward) don’t introduce phase shifts but can create artifacts at signal boundaries. Minimum-phase filters preserve causality but introduce phase delays.
For offline analysis, I almost always use zero-phase filtering because phase relationships are often important for EEG interpretation. For real-time applications (like BCI), you’re stuck with causal filters and need to account for the phase delays.
The Notch Filter Dilemma
Notch filters for removing line noise (50/60 Hz) are controversial because they can remove genuine neural activity along with the noise. But sometimes the line noise is so bad that you don’t have a choice.
I used to avoid notch filters religiously until I encountered a dataset with massive 60 Hz contamination that completely swamped the neural signals. Traditional eeg filtering approaches weren’t effective because the line noise was orders of magnitude larger than the EEG signals.
Modern alternatives to traditional notch filtering:
- Cleanline algorithm: Uses multitaper spectral estimation to identify and remove line noise more precisely
- Zapline: Uses temporal decomposition to separate line noise from neural activity
- Spectral interpolation: Identifies contaminated frequencies and interpolates across them
[Before/after comparison showing different line noise removal techniques]
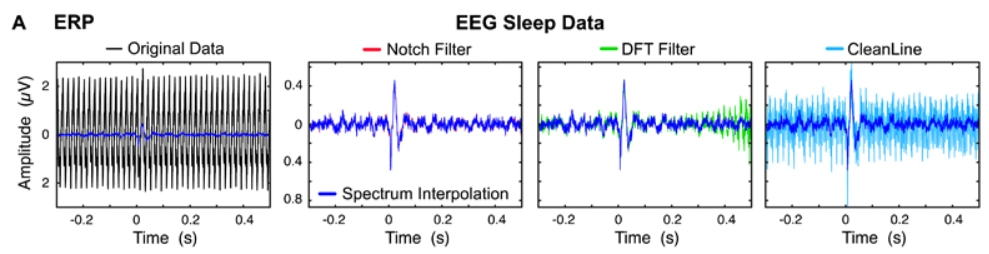
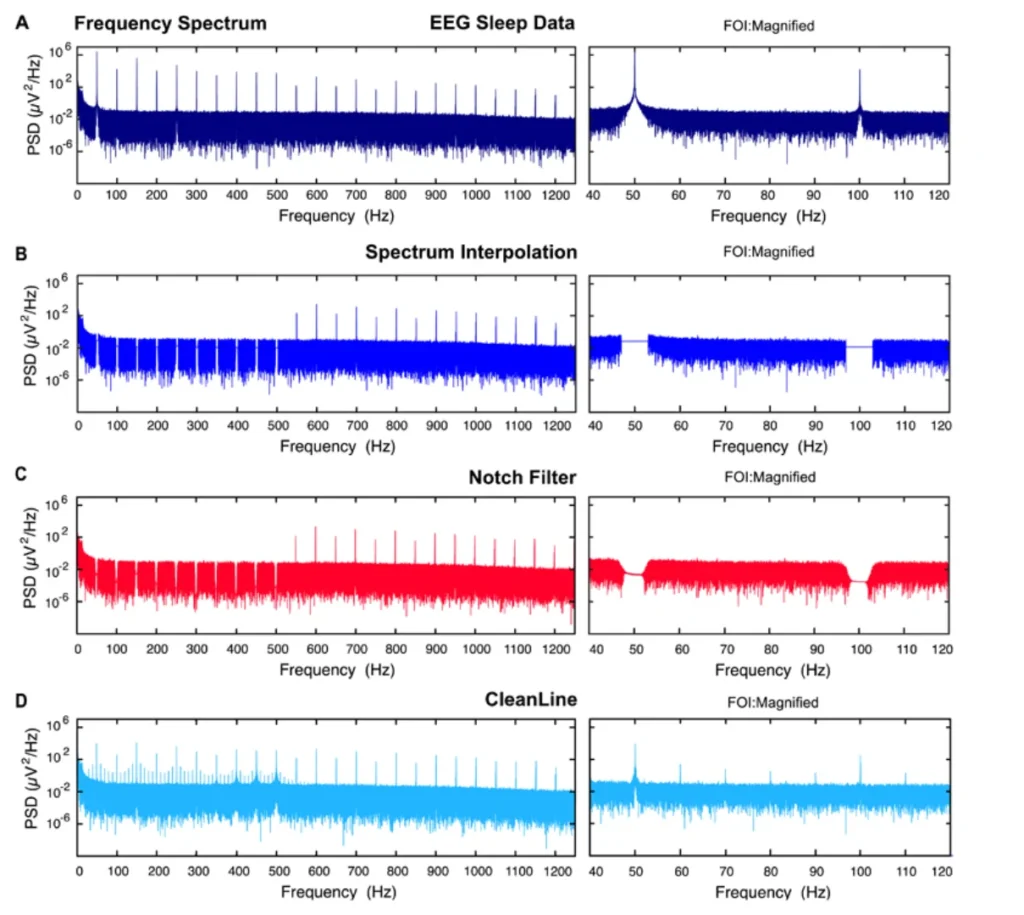
Image source:Leske, S., & Dalal, S. S. (2019). Reducing power line noise in EEG and MEG data via spectrum interpolation. NeuroImage, 189, 763–776. https://doi.org/10.1016/j.neuroimage.2019.01.026
I’ve started using the CleanLine algorithm in EEGLAB for datasets with significant line noise. It’s more sophisticated than simple notch filtering and seems to preserve more neural activity while effectively removing the contamination.
Filter Artifacts: The Ghosts in Your Machine
Filter artifacts are probably the most insidious preprocessing problem because they can look like real neural activity. I’ve learned to be paranoid about filter artifacts, especially when I see unexpected results that seem too good to be true.
Ringing artifacts: High-order filters can create oscillatory artifacts around sharp transients like stimulus onsets or movement artifacts. These can look like genuine neural oscillations if you’re not careful.
I discovered this during an attention study where I was seeing beautiful theta oscillations time-locked to stimulus onset. It took weeks to realize that my aggressive filtering was creating ringing artifacts that looked exactly like the attentional theta responses I was expecting to find.
Edge effects: All filters behave poorly at the beginning and end of data segments. This is especially problematic for epoched data, where filter artifacts at epoch boundaries can contaminate your entire trial.
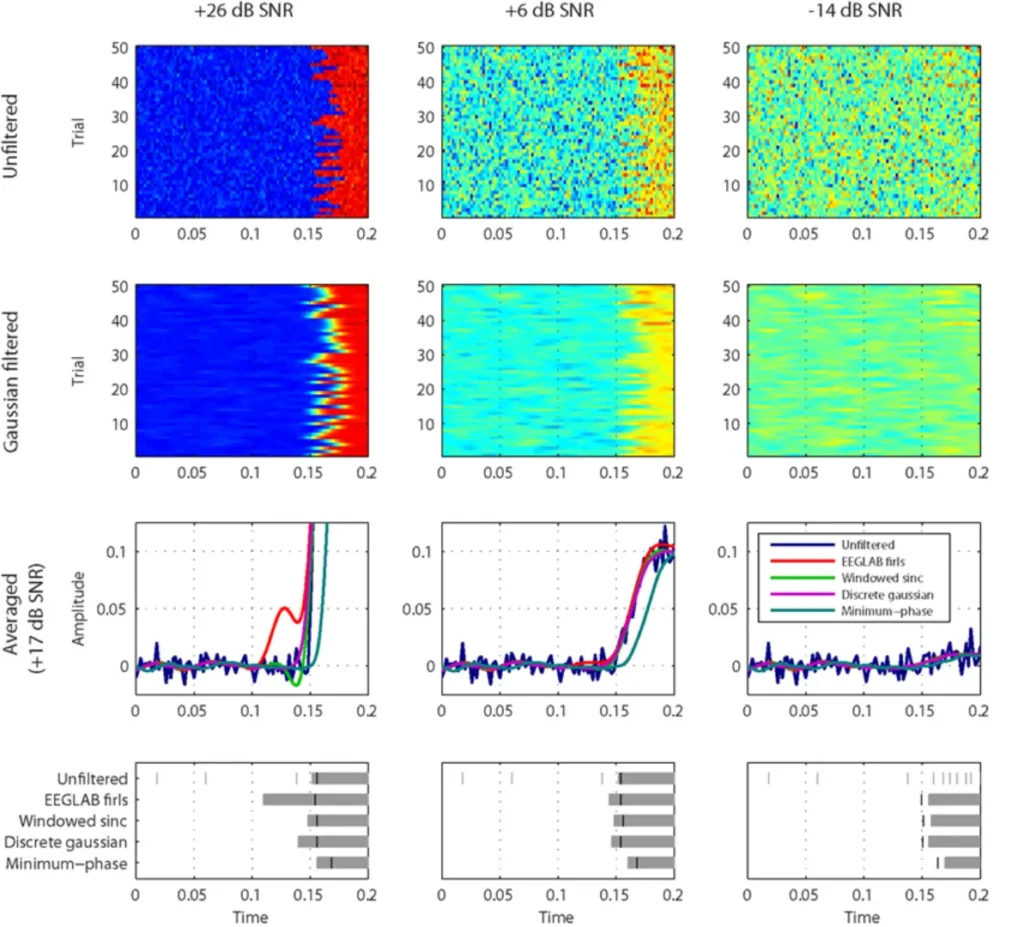
Image source:Widmann, A., & Schröger, E. (2012). Filter effects and filter artifacts in the analysis of electrophysiological data. Frontiers in Psychology, 3. https://doi.org/10.3389/fpsyg.2012.00233
The solution: Always pad your epochs with extra data before filtering, then trim them back to your desired length after filtering. This pushes the edge artifacts outside your analysis window.
Practical Implementation Strategies
Based on years of fighting with filter artifacts, here’s my practical workflow:
Step 1: Assess your data first. Look at the power spectrum and identify the major noise sources before deciding on filter parameters. Don’t just apply default settings.
Step 2: Filter conservatively. It’s better to live with some noise than to introduce filter artifacts. You can always filter more aggressively later if needed.
Step 3: Always inspect filtered data visually. Look for ringing, overshoot, and other temporal artifacts, especially around stimulus onsets or other sharp transitions.
Step 4: Compare filtered vs. unfiltered results. If your main findings disappear or change dramatically with different filter settings, be suspicious.
Modern EEG Filtering Approaches
Traditional eeg filtering approaches are being supplemented by more sophisticated techniques that can separate noise from signal more effectively:
Empirical Mode Decomposition (EMD): Decomposes signals into intrinsic mode functions that can be filtered individually. It’s data-adaptive rather than relying on fixed frequency bands.
Artifact Subspace Reconstruction (ASR): Identifies and corrects corrupted data segments in real-time using principal component analysis. It’s especially useful for removing high-amplitude artifacts without affecting clean portions of the data.
Temporal filtering with ICA: Apply ICA first to separate neural sources from artifacts, then filter the components individually based on their characteristics.
I’ve been experimenting with ASR for removing muscle artifacts, and the results are promising. It seems to preserve gamma-band neural activity better than traditional filtering while effectively removing EMG contamination.
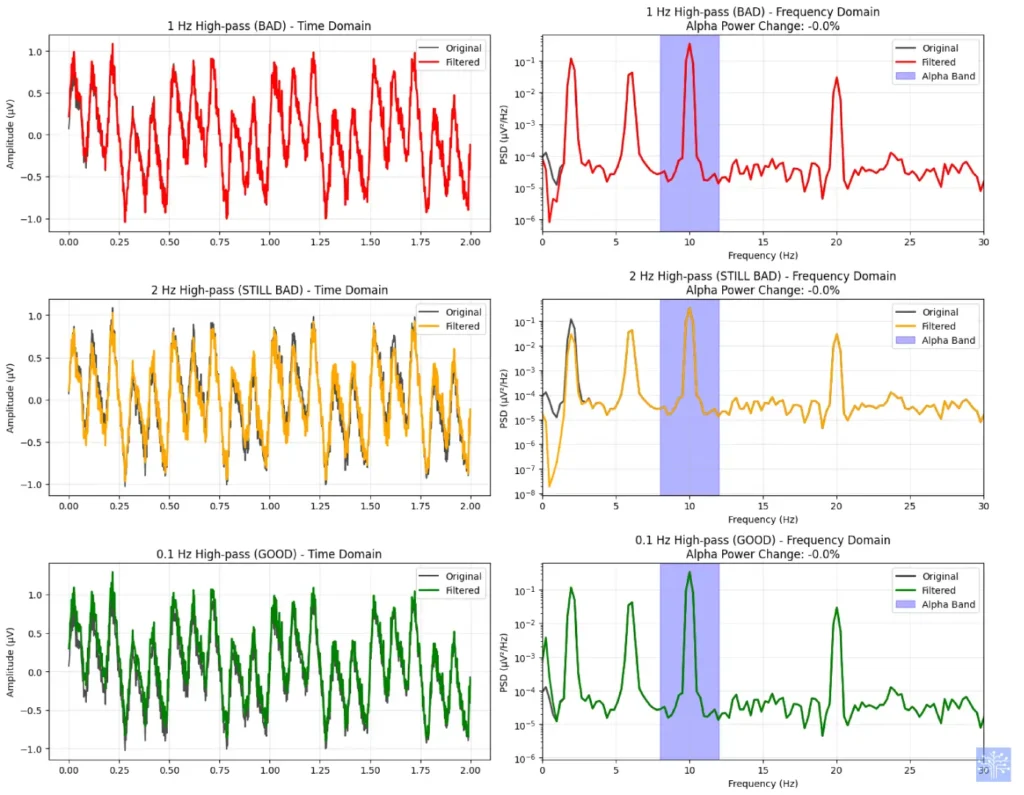
The Gotcha That Ruins Frequency Analysis
Here’s the mistake that’ll absolutely wreck your spectral analysis: applying filters with cutoffs near your frequencies of interest. I see this constantly – people studying alpha oscillations (8-12 Hz) with high-pass filters at 1-2 Hz, not realizing that the filter’s transition band extends well into the alpha range.
The filter transition band (where the response gradually rolls off) can introduce phase shifts and amplitude distortions that contaminate your frequency analysis. Always ensure that your filter cutoffs are well separated from your frequencies of interest – at least 2-3 Hz separation for typical filter designs.
Your Next Steps
Before applying any filter to your data, I’d recommend this systematic approach:
- Examine your raw data spectrum to understand what noise sources you’re dealing with
- Define your frequencies of interest and ensure your filter cutoffs don’t interfere with them
- Test different filter parameters on a subset of your data and examine the results visually
- Validate your eeg filtering approach by checking that your main findings are robust across reasonable parameter variations
Most importantly, always document your filtering parameters and the rationale behind them. Filter settings that seem obvious when you’re implementing them can be mysterious months later when you’re trying to interpret results or replicate the analysis.
EEG Filtering is one of those preprocessing steps where the details really matter. Get it right, and you’ll remove noise while preserving the neural signals you care about. Get it wrong, and you might spend months analyzing artifacts thinking they’re meaningful brain activity.
Next, we’ll explore re-referencing strategies – another preprocessing choice that fundamentally changes what you’re measuring, often in ways that aren’t immediately obvious.
What is EEG – https://circuitprofessor.com/understanding-eeg-signals/