
Understanding the Brain’s Electrical Language: What EEG Really Captures (And Why It Matters for Your Models)
You know that moment when you’re staring at EEG data at 2 AM, wondering if those squiggly lines actually mean anything? I’ve been there. Actually, I spent months during my early research thinking I could just throw raw EEG into a neural network and call it a day. Spoiler alert: that didn’t work out so well.
Here’s the thing about EEG – it’s not just recording brain activity. It’s eavesdropping on one of the most sophisticated electrical conversations in the known universe. And if we’re going to build machine learning models that actually work with this data, we need to understand what that conversation really sounds like.
The Electrical Symphony Inside Your Head
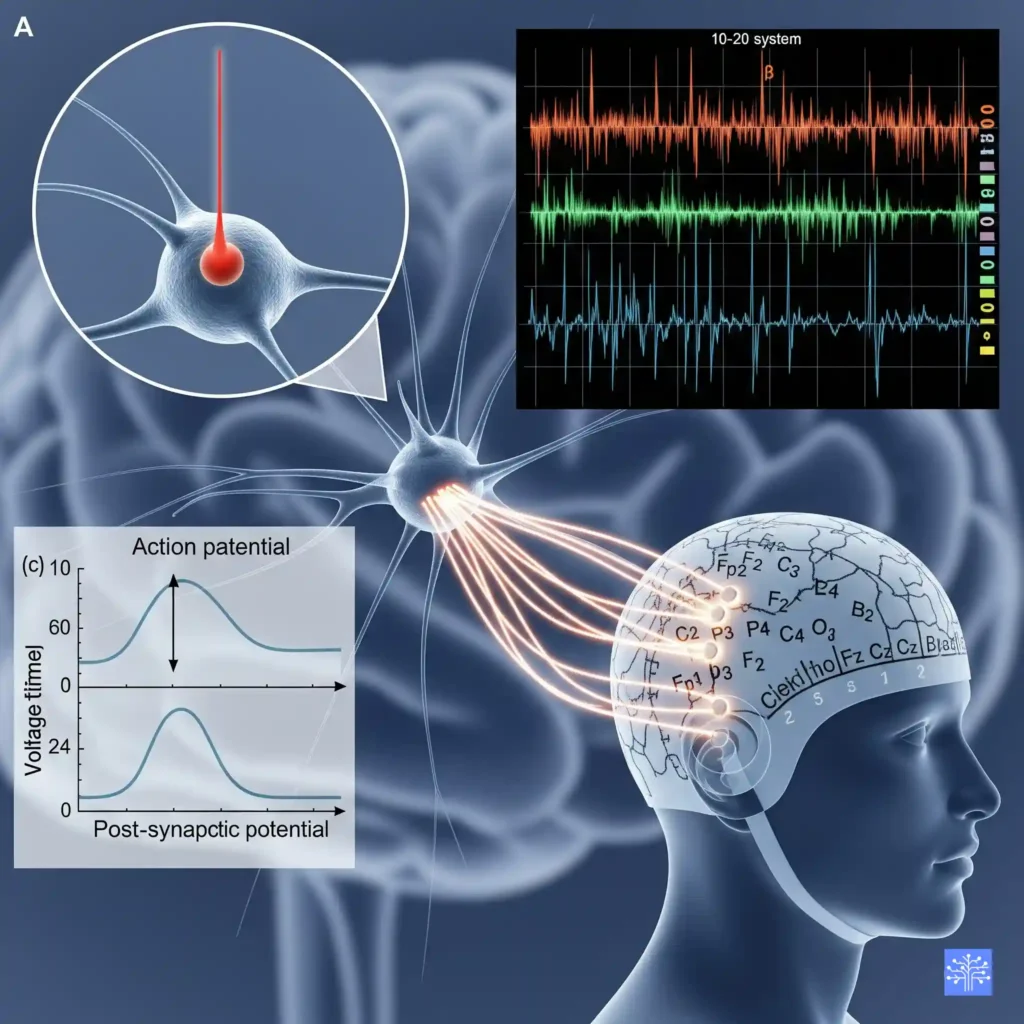
Think of your brain like a massive orchestra, but instead of violins and trumpets, you’ve got roughly 86 billion neurons firing electrical signals. Each neuron is basically a tiny battery – when it gets excited enough, it dumps sodium ions across its membrane and creates what we call an action potential. That’s the fundamental unit of neural communication.
But here’s where it gets interesting (and where I had my first real “aha moment” in neurophysiology). The EEG isn’t actually picking up these action potentials directly. Nope. What we’re measuring are the post-synaptic potentials – the electrical changes that happen when neurotransmitters hit the receiving end of synapses.
Picture this: imagine you’re trying to listen to a conversation in a crowded restaurant. The action potentials are like individual words spoken at each table – too quiet and scattered for you to hear from across the room. But the post-synaptic potentials? Those are like the overall buzz and murmur of the entire restaurant. That’s what your EEG electrodes are picking up through the skull.
Why Cortical Pyramidal Neurons Are Your Best Friends
Now, not all neurons contribute equally to what we see in EEG. The real MVPs(most valuable player) here are the cortical pyramidal neurons. These guys are perfectly designed for EEG detection, and I mean perfectly. They’re arranged in neat columns perpendicular to the cortical surface, they’re large, and they have this beautiful dendritic tree structure that acts like a natural amplifier.
When thousands of these pyramidal neurons fire in sync (which happens more often than you’d think), their post-synaptic potentials add up. It’s like having a choir where everyone’s singing the same note – suddenly you can hear it from the back of the auditorium. That’s why we can detect brain activity through several layers of tissue and bone with something as simple as a metal disk on the scalp.
Actually, let me share something that blew my mind when I first learned it. The EEG signal we record represents the synchronized activity of around 50,000 to 100,000 neurons firing within about 6 square centimeters of cortex. Think about that for a second – your machine learning model is trying to decode the collective behavior of roughly a small city’s worth of neurons from each electrode.
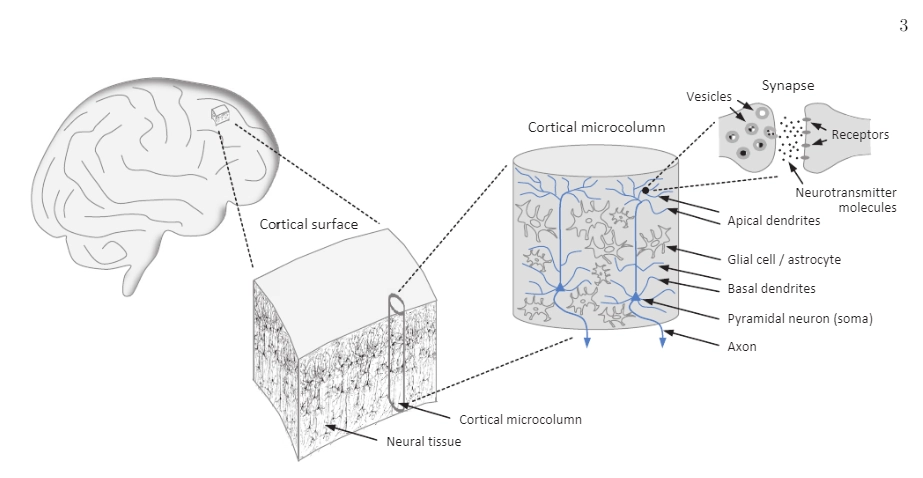
Image credit: Joachim Keppler (2023). Scrutinizing the Feasibility of Macroscopic Quantum Coherence in the Brain: A Field-Theoretical Model of Cortical Dynamics. DOI: 10.1101/2023.03.03.530961
The Signal You’re Actually Working With
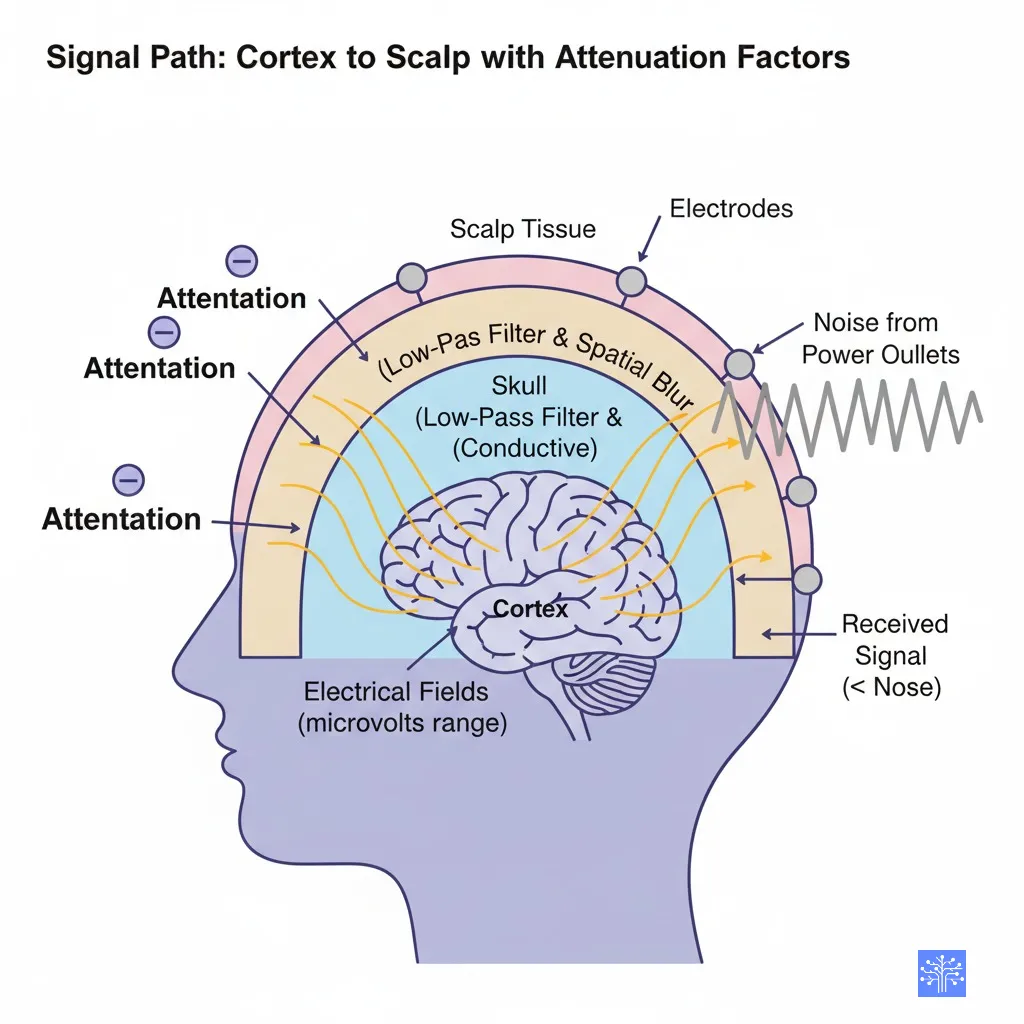
Here’s where things get both fascinating and frustrating. The EEG signal reaching your electrodes has traveled through cerebrospinal fluid, three layers of protective membranes (the meninges), skull bone, muscle, and skin. Each layer acts like a low-pass filter, smoothing out the sharp edges and reducing the amplitude.
What you end up with is something like trying to understand a symphony while listening through several walls – you get the rhythm, the overall dynamics, maybe some of the major themes, but a lot of the fine details are lost. This is why EEG has excellent temporal resolution (we’re talking millisecond precision) but relatively poor spatial resolution compared to something like fMRI. (Read temporal vs spatial resolution )
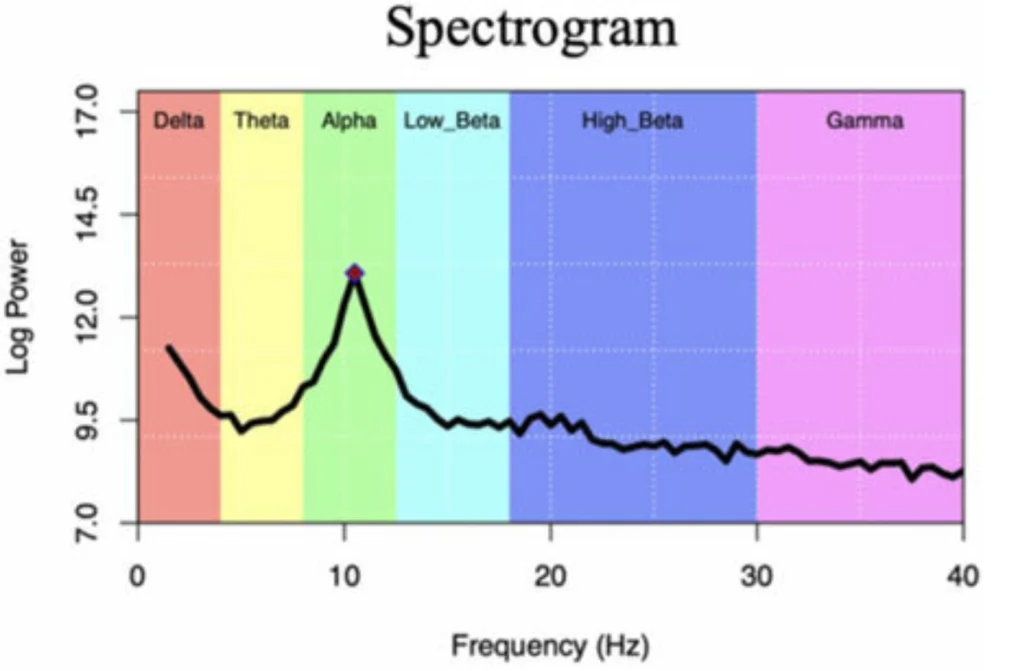
The frequency content tells its own story too. Those classic frequency bands we all know – delta, theta, alpha, beta, gamma – they’re not just arbitrary divisions. They reflect different types of neural network activity:
- Delta (0.5-4 Hz): Deep sleep, unconscious states. When I see strong delta in awake subjects, I start checking if they’re about to fall asleep on me.
- Theta (4-8 Hz): Memory formation, drowsiness. Huge for anyone working on cognitive load detection.
- Alpha (8-13 Hz): Relaxed wakefulness, eyes closed. The classic “I’m awake but not thinking hard” rhythm.
- Beta (13-30 Hz): Active thinking, focused attention. This is where a lot of BCI applications live.
- Gamma (30+ Hz): High-level cognitive processing, consciousness itself maybe? Still debating this one in the field.
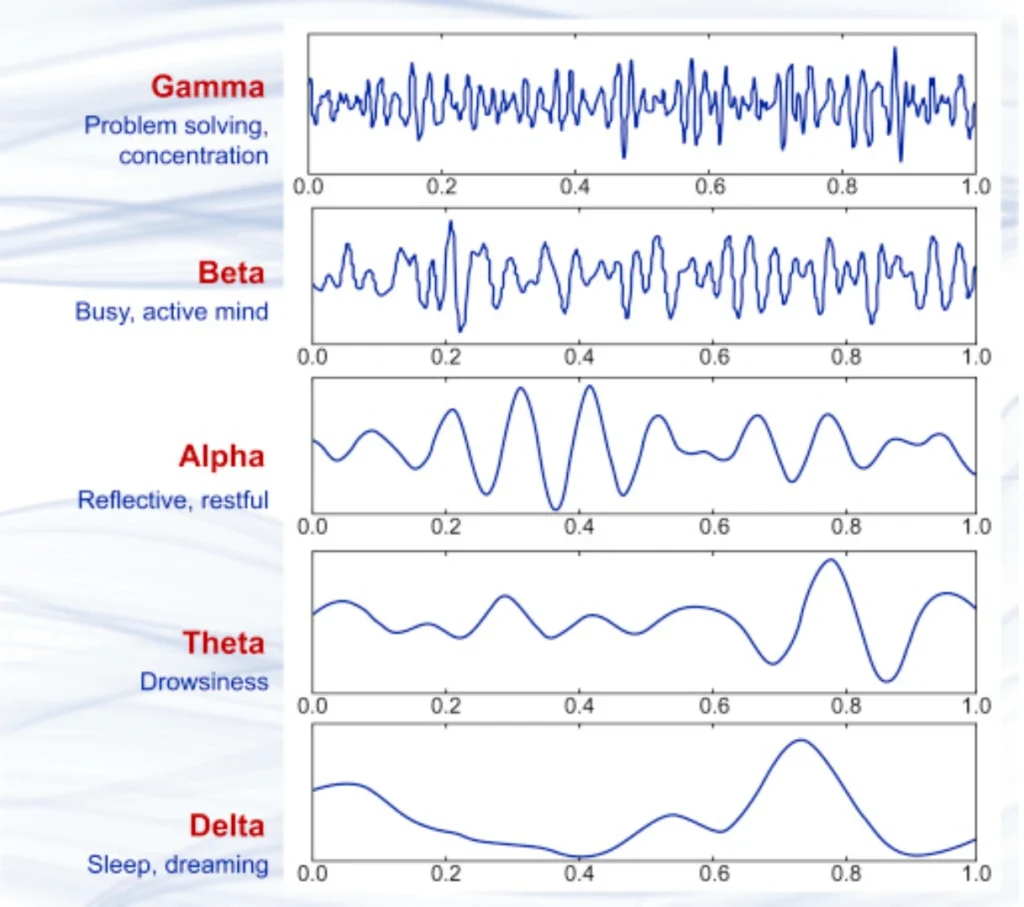
Image credit:Priyanka A. Abhang, Bharti W. Gawali, Suresh C. Mehrotra,
Chapter 2 – Technological Basics of EEG Recording and Operation of Apparatus,
Editor(s): Priyanka A. Abhang, Bharti W. Gawali, Suresh C. Mehrotra,
Introduction to EEG- and Speech-Based Emotion Recognition,
Academic Press,
2016,
Pages 19-50,
ISBN 9780128044902,
https://doi.org/10.1016/B978-0-12-804490-2.00002-6.
(https://www.sciencedirect.com/science/article/pii/B9780128044902000026)
What Your Textbook Doesn’t Tell You
Okay, here’s some practical stuff I wish someone had told me earlier. First, the reference electrode matters way more than most people realize. I’ve seen countless students (myself included) completely mess up their analysis because they didn’t understand that EEG always measures voltage differences, never absolute voltages.
When you see that EEG signal, you’re looking at the difference between your active electrode and your reference. Change the reference, and you change your data. Common average reference? Linked mastoids? Each choice colors your results differently. I personally prefer average reference for most applications, but linked ears can be cleaner if you’re not interested in the temporal regions.
Second gotcha: artifact rejection. Everyone talks about removing eye blinks and muscle artifacts, but here’s what they don’t tell you – sometimes the “artifact” is actually the signal you want. Working on drowsiness detection? Those slow eye movements might be gold. Studying motor imagery? Muscle tension could be informative. Don’t just blindly filter everything out.
And please, for the love of all that’s holy, check your impedances. I’ve seen beautiful-looking models that were essentially learning to classify electrode contact quality rather than brain states. Keep those impedances under 5 kΩ, preferably under 2 kΩ.
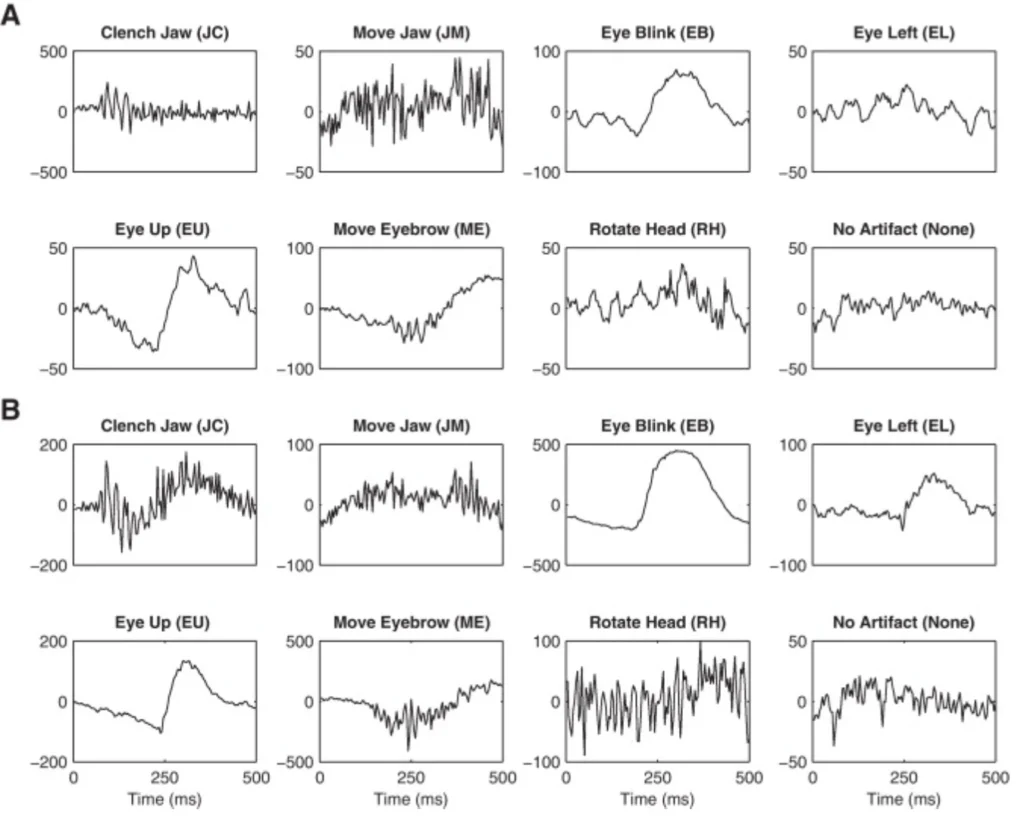
Image credit:Vernon Lawhern, W. David Hairston, Kaleb McDowell, Marissa Westerfield, Kay Robbins,
Detection and classification of subject-generated artifacts in EEG signals using autoregressive models,
Journal of Neuroscience Methods,
Volume 208, Issue 2,
2012,
Pages 181-189,
ISSN 0165-0270,
https://doi.org/10.1016/j.jneumeth.2012.05.017.
(https://www.sciencedirect.com/science/article/pii/S0165027012001860)
The Machine Learning Connection
Here’s where understanding neurophysiology really pays off for your models. When you know that EEG reflects synchronized network activity, you start thinking differently about feature engineering. Raw voltage values? Not so useful. But connectivity between regions, phase relationships, spectral power in specific bands – now you’re speaking the brain’s language.
I learned this the hard way trying to classify mental workload. My first models used simple spectral features and got maybe 65% accuracy. But when I started incorporating phase coupling measures and looking at how different brain regions synchronized their oscillations, accuracy jumped to over 85%. The brain isn’t just a collection of independent signal generators – it’s a network, and the relationships between nodes often matter more than the individual signals.
Looking Forward: What This Means for Your Work
Understanding the neurophysiology behind EEG isn’t just academic curiosity – it’s practical intelligence that’ll make your models better. When you know that you’re capturing synchronized post-synaptic potentials from cortical pyramidal neurons, you understand both the power and limitations of your data.
You’ll stop expecting EEG to tell you about deep brain structures (it won’t, not directly). You’ll start appreciating why certain preprocessing steps matter. You’ll design features that actually align with how the brain generates these signals.
My advice? Spend some time with Kandel, Schwartz & Jessell’s “Principles of Neural Science” – it’s dense but worth it. For EEG-specific neurophysiology, Niedermeyer & da Silva’s “Electroencephalography” is the gold standard. And keep an eye on Nature Neuroscience and Brain for the latest on how neural networks actually generate the oscillations we record.
The brain’s electrical language is incredibly rich and complex. The more fluent you become in understanding what EEG actually represents, the better your models will be at extracting meaningful information from those squiggly lines. Trust me, your future self (and your accuracy metrics) will thank you.

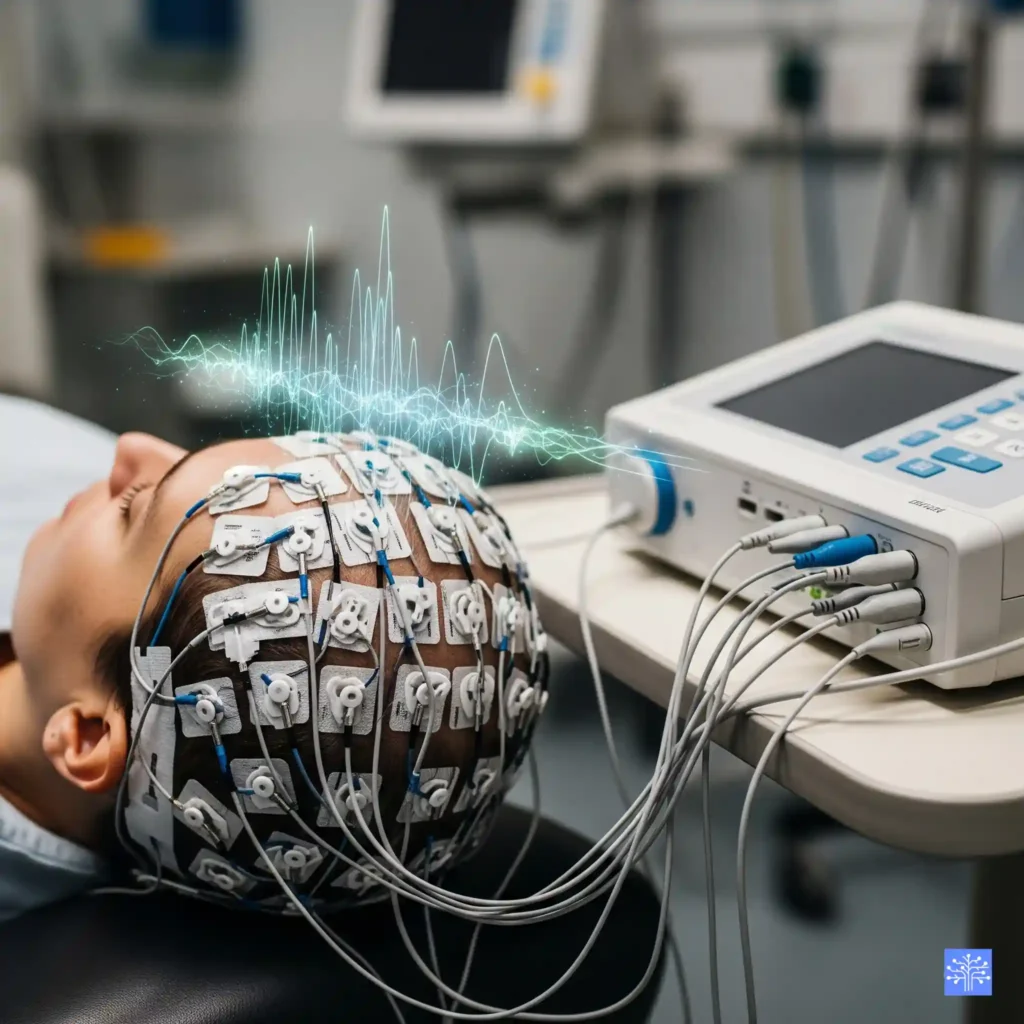
Ever stared at raw EEG data and wondered what the hell you’re actually looking at? I mean, really looking at? Those squiggly lines dancing across your screen aren’t just random electrical noise – they’re quite literally thoughts, emotions, and consciousness itself, translated into voltage fluctuations so tiny you need to amplify them a million times just to see them.
I’ll never forget my first encounter with “real” EEG data during my research. My advisor handed me a dataset and said, “Figure out what’s happening in the brain during this task.” Easy, right? Wrong. I spent weeks staring at those traces, convinced I was missing something obvious. Turns out, I was. I didn’t understand what I was actually measuring.
The Orchestra Analogy That Changed Everything
Here’s the thing that finally clicked for me, and I hope it’ll save you some of the confusion I went through. Think of your brain like a massive underground subway system, but instead of trains, you’ve got electrical signals zipping around. Now, EEG? It’s like trying to figure out the entire subway schedule by listening to the rumbling from street level.
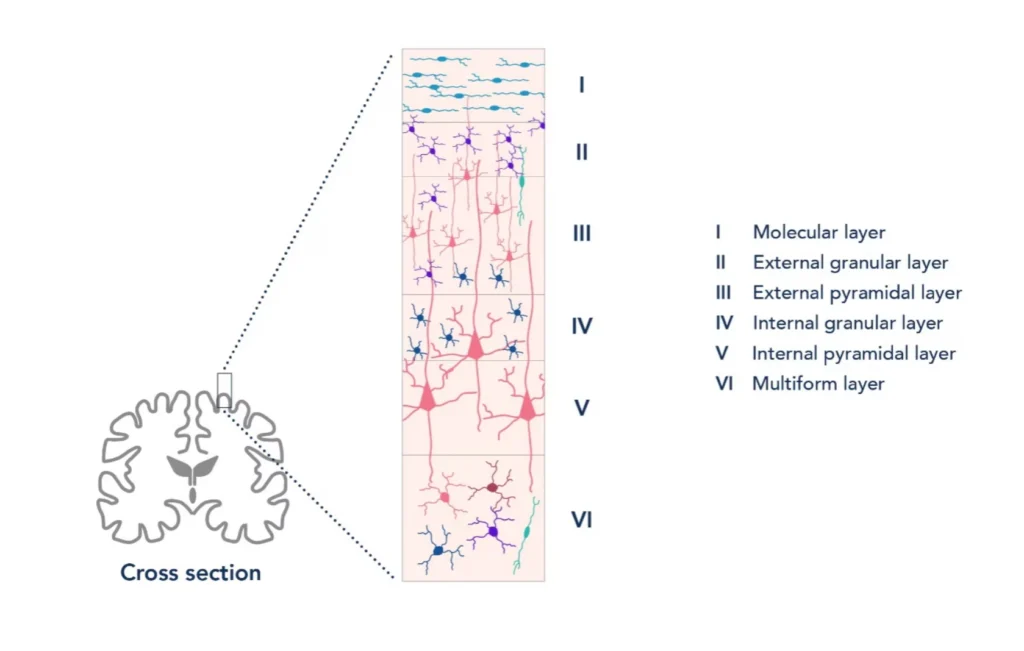
Image credit:https://www.ptglab.com/news/blog/identifying-cortical-cell-types-through-immunofluorescence-and-electrophysiology/
You’re not hearing individual trains (that would be single neurons firing). You’re hearing the collective rumble of thousands of trains moving in roughly the same direction at roughly the same time. That rumble – that’s your EEG signal.
Actually, let me get more specific because this matters for everything you’ll do downstream. When we talk about EEG signals, we’re primarily measuring post-synaptic potentials from cortical pyramidal neurons. Not action potentials. This was my first major “wait, what?” moment.
What You’re Really Measuring (And Why It Matters)
Action potentials are those sharp, binary spikes you see in single-cell recordings – the classic “neuron fires or doesn’t fire” events. But EEG? We’re measuring something much more subtle and, honestly, much more interesting from a signal processing perspective.
Post-synaptic potentials are these slower, graded voltage changes that happen when neurotransmitters bind to receptors on the receiving end of synapses. They’re not binary – they have magnitude, duration, and they can add up. Most importantly for us EEG folks, when thousands of pyramidal neurons in the same cortical column experience similar post-synaptic potentials simultaneously, their electric fields align and create something we can actually measure from the scalp.
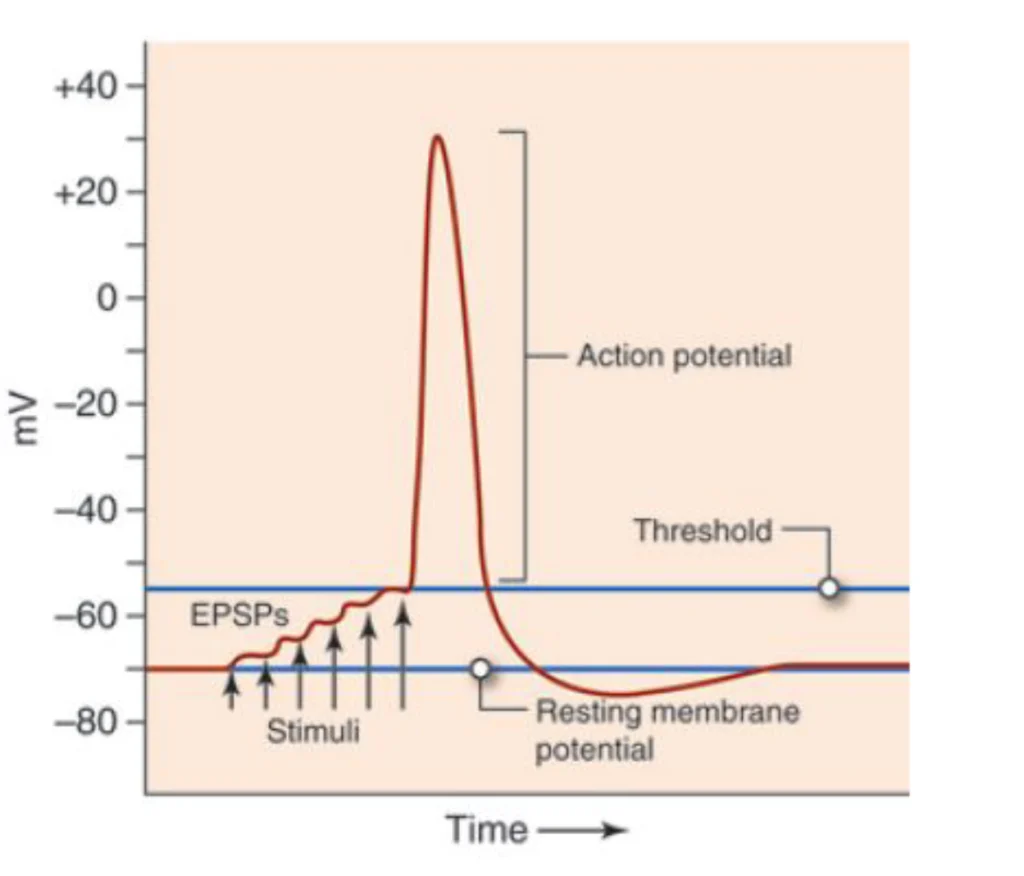
Image credit:https://www.nursinghero.com/study-guides/cuny-csi-ap-1/synapses
Now, here’s where it gets really interesting (and where a lot of people get tripped up): cortical pyramidal neurons have this beautiful, organized structure. They’re arranged in columns, perpendicular to the cortical surface, with their dendrites extending toward the surface and their cell bodies deeper in the cortex. When they’re active synchronously, they create what we call an “open field” configuration – basically a tiny battery with thousands of cells contributing to the same electrical field.
The Physics That Makes EEG Possible
I need to pause here and share something that took me way too long to appreciate. The fact that we can measure brain activity from the scalp is actually kind of miraculous when you think about the physics involved.
Your brain generates electrical fields in the microvolts range. Then these signals have to travel through cerebrospinal fluid (which is conductive), through the skull (which acts like a low-pass filter and spatial blur), through scalp tissue, and finally reach our electrodes. By the time they get there, we’re talking about signals that are literally smaller than the noise from your power outlets.
But here’s the thing – and this is where understanding the source matters for your preprocessing choices – we can only see electrical activity that meets very specific criteria:
- Synchronous activation: Thousands of neurons need to fire together within a few milliseconds
- Proper orientation: The neurons need to be oriented perpendicular to the scalp surface (why we mostly see cortical activity, not subcortical)
- Spatial extent: The active area needs to cover at least 6-10 cm² of cortical surface
- Temporal coherence: The activity needs to last long enough (tens to hundreds of milliseconds) to survive the biological filtering
Why This Matters for Your Machine Learning Pipeline
Okay, so why am I going on about pyramidal neurons and post-synaptic potentials? Because understanding your signal source fundamentally changes how you should approach feature extraction and preprocessing.
When I was starting out, I treated EEG like any other time series. Big mistake. EEG isn’t just any signal – it’s the surface manifestation of organized, large-scale neural computation. This means:
For frequency analysis: Those classic frequency bands (delta, theta, alpha, beta, gamma) aren’t arbitrary divisions. They reflect different types of neural synchronization patterns. Alpha oscillations around 10 Hz, for instance, often represent synchronized thalamo-cortical loops during relaxed wakefulness.
For spatial analysis: The topographic patterns you see aren’t random. They reflect the underlying cortical architecture and the fact that we’re measuring field potentials, not point sources.
For temporal analysis: Those event-related potentials (ERPs) you might be extracting as features? They’re time-locked averages of post-synaptic activity, which is why they have those characteristic positive and negative deflections over specific time windows.
The Gotcha That Bites Everyone
Here’s something that’ll save you debugging time down the road: EEG signals are reference-dependent. Always. This isn’t just a technical detail – it’s fundamental to what you’re measuring.
Every EEG recording is actually measuring voltage differences between electrodes. There’s no such thing as “absolute” EEG voltage at a single electrode. When you see papers talking about “Cz activity” or “frontal theta,” they’re implicitly talking about activity relative to whatever reference they chose (linked mastoids, average reference, REST, etc.).
I’ve seen way too many machine learning pipelines treat EEG channels as independent features without considering that they’re all measuring relative voltage differences. Don’t make that mistake.
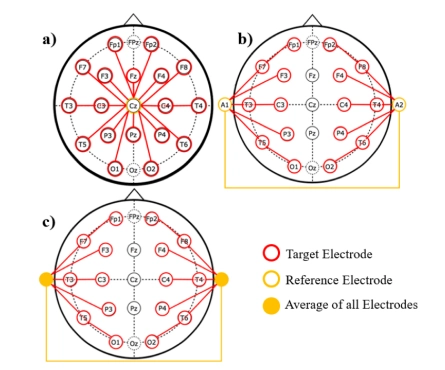
Image credit:Lopez, S., Gross, A., Yang, S., Golmohammadi, M., Obeid, I., & Picone, J. (2016). An analysis of two common reference points for EEGS. IEEE Signal Processing in Medicine and Biology Symposium. Philadelphia, Pennsylvania, USA, 1–5. https://doi.org/10.1109/spmb.2016.7846854
a) Average Reference: All electrodes are referenced to the average of all electrode potentials. This creates a balanced reference across the entire scalp.
b) Linked Mastoids Reference: Electrodes are referenced to the average of the two mastoid electrodes (behind the ears, shown in yellow boxes). This is a common clinical reference.
c) Linked Earlobes Reference: Electrodes are referenced to the average of the two earlobe electrodes (shown in yellow boxes). This provides a relatively neutral reference point away from brain activity.
Where This Connects to Everything Else
Understanding the neurophysiological basis of EEG sets you up for everything that comes next in your machine learning journey. When you start diving into preprocessing (which we’ll cover in the next articles), you’ll understand why certain artifacts look the way they do and why specific removal techniques work.
When you get into feature extraction, you’ll appreciate why frequency-domain features are so powerful – they’re tapping into the fundamental oscillatory nature of neural computation. And when you start building classifiers, you’ll understand why spatial patterns and temporal dynamics are so informative.
Your Next Steps
Before you dive deeper into the technical implementation stuff, I’d strongly recommend spending some time with the foundational literature. Kandel, Schwartz & Jessell’s “Principles of Neural Science” remains the gold standard for understanding the neurophysiology. For EEG-specific content, Niedermeyer & da Silva’s “Electroencephalography” is dense but comprehensive.
But honestly? The best way to internalize this stuff is to play with real data while keeping these principles in mind. Load up some EEG data, plot it, and ask yourself: “What am I actually looking at here? What neural processes could produce these patterns?”
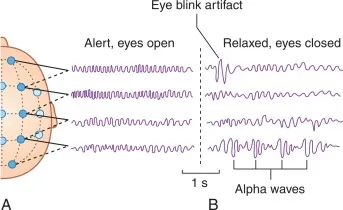
Image credit:https://neupsykey.com/electroencephalography-5/
Trust me, once you really get this foundational stuff, everything else in EEG signal processing starts making a lot more sense. The preprocessing steps aren’t just arbitrary signal cleaning operations – they’re principled approaches to extracting meaningful neural information from noisy measurements of brain electrical activity.
Read EEG filtering-https://circuitprofessor.com/the-eeg-filtering/